


 40 / 96

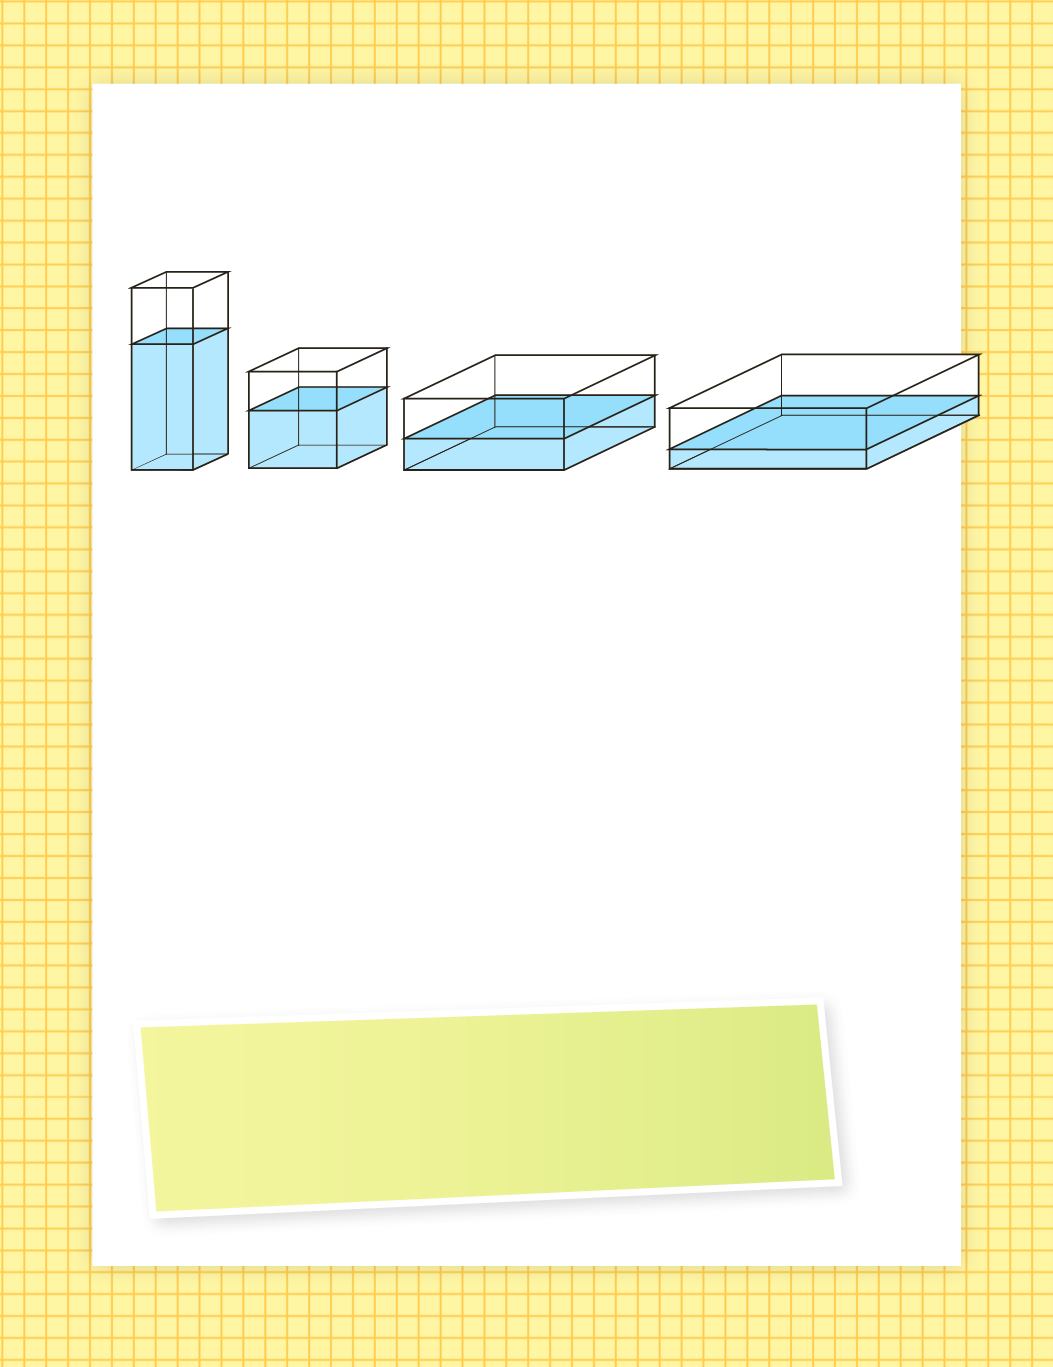
1
4
3
2
The two students number the boxes. The box with the smallest
surface area is number 1. The box with the biggest surface area is
number 4. Then they measure 50 milliliters (mL) of water into each
box. They place the four boxes on the counter by a window.
One week later, Julie and Art measure the amount of water in each
box. Box 1 has 46 mL, box 2 has 42 mL, box 3 has 34 mL, and box
4 has 18 mL.
Art thinks about the results. It seems that the surface area of the
water in the boxes has an effect on the evaporation. But he isn’t sure.
Julie suggests organizing the results of the experiment. The students
decide to do the following.
•
Make a T-table to display the data.
•
Make a graph of the data.
•
Describe what they learned from the experiment.
Can you help Julie and Art? Use the information they gathered
to write a report about the effect of surface area on evaporation.
Be sure to include the three kinds of information listed above.
Thinking about the Experiment
What additional information would be useful to better
understand how surface area affects evaporation?
40